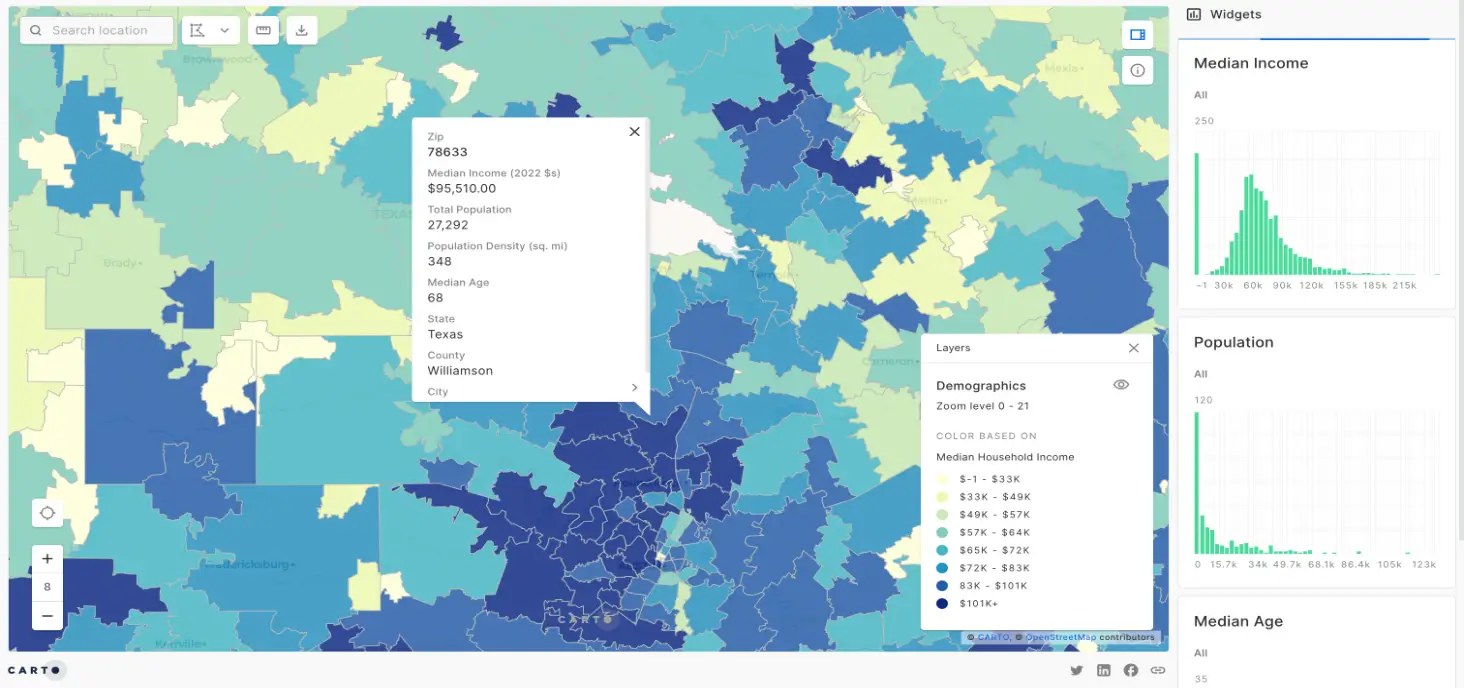
Skip spending 40+ hours on Census.gov, learning cumbersome software, or paying 10x as much for a file stuffed with data you'll never use.
Every Income By Zip Code List includes:
You'll also get the following geography data:
A | B | C | D | E | F | G | H | I | J | K | L | M | N | O | P | Q | R | S | T | U | V | W | X | Y | Z | AA | AB | AC | |
---|---|---|---|---|---|---|---|---|---|---|---|---|---|---|---|---|---|---|---|---|---|---|---|---|---|---|---|---|---|
1 | Zip (ZCTA) | State | County | City | Median Household Income | Margin of Error | Mean Income | Margin of Error | Per Capita Income | Margin of Error | Percent of Households with Incomes $200K+ | Margin of Error | Median Household Income by Age of Householder | Household Income in the past 12 months | Land Area sq. m. | ||||||||||||||
Householder under 25 years | Margin of Error | Householder 25 to 44 years | Margin of Error | Householder 45 to 64 years | Margin of Error | Householder 65 years and over | Margin of Error | Households | Less than $25,000 | $25,000 to $49,999 | $50,000 to $74,999 | $75,000 to $99,999 | $100,000 to $149,999 | $150,000 to $199,999 | $200,000 or more | ||||||||||||||
5 | 01001 | Massachusetts | Hampden | Agawam Town | $72,444 | $7,594 | $94,323 | $7,189 | $41,144 | $3,166 | 7.2% | 2.6% | -$1 | -$1 | $89,464 | $35,459 | $102,075 | $14,139 | $47,379 | $9,025 | 6,791 | 947 | 1,353 | 1,187 | 689 | 1,406 | 718 | 491 | 29,247,431 |
6 | 01002 | Massachusetts | Franklin; Hampshire | Amherst Town; Pelham; Shutesbury | $65,013 | $13,710 | $104,186 | $16,083 | $38,627 | $4,833 | 13.9% | 3.5% | $17,431 | $7,648 | $81,969 | $18,090 | $107,578 | $31,692 | $83,889 | $10,815 | 9,985 | 2,624 | 1,520 | 1,185 | 967 | 1,418 | 885 | 1,386 | 137,931,891 |
7 | 01003 | Massachusetts | Hampshire | Amherst Town | -$1 | -$1 | -$1 | -$1 | $4,935 | $591 | 33.3% | 65.5% | -$1 | -$1 | -$1 | -$1 | -$1 | -$1 | -$1 | -$1 | 15 | 0 | 10 | 0 | 0 | 0 | 0 | 5 | 2,082,670 |
8 | 01005 | Massachusetts | Worcester | Barre | $103,477 | $25,982 | $106,135 | $13,145 | $39,783 | $4,894 | 9.9% | 6.6% | -$1 | -$1 | $90,568 | $37,252 | $109,496 | $14,691 | $80,667 | $48,917 | 1,761 | 110 | 175 | 415 | 158 | 614 | 115 | 174 | 111,859,191 |
9 | 01007 | Massachusetts | Hampshire | Belchertown; Pelham | $101,076 | $8,471 | $113,474 | $7,311 | $43,450 | $2,854 | 10.5% | 3.0% | $32,950 | $24,375 | $116,586 | $7,763 | $125,615 | $18,851 | $52,027 | $13,123 | 5,917 | 525 | 795 | 816 | 773 | 1,707 | 678 | 623 | 142,111,112 |
10 | 01008 | Massachusetts | Berkshire; Hampden | Blandford; Granville; Otis; Tolland | $79,573 | $11,470 | $99,407 | $10,288 | $43,288 | $4,455 | 9.5% | 4.2% | -$1 | -$1 | $84,750 | $22,916 | $111,364 | $12,839 | $47,813 | $10,448 | 506 | 39 | 104 | 76 | 78 | 112 | 49 | 48 | 158,470,969 |
11 | 01009 | Massachusetts | Hampden | Palmer Town | $64,809 | $35,782 | $84,135 | $34,453 | $34,027 | $17,302 | 10.5% | 16.5% | -$1 | -$1 | $64,836 | $57,275 | -$1 | -$1 | -$1 | -$1 | 333 | 78 | 13 | 81 | 71 | 43 | 12 | 35 | 1,806,483 |
12 | 01010 | Massachusetts | Hampden; Worcester | Brimfield; Warren | $84,830 | $26,749 | $112,574 | $27,946 | $45,461 | $9,549 | 13.9% | 8.7% | -$1 | -$1 | $106,250 | $38,698 | $115,972 | $60,624 | $33,672 | $11,958 | 1,503 | 262 | 270 | 160 | 125 | 263 | 214 | 209 | 91,236,290 |
Differentiate zip codes by adding demographics to your income data.
A | B | C | D | E | F | G | H | I | J | K | L | M | N | O | P | Q | R | S | T | U | V | W | X | Y | Z | AA | AB | AC | AD | AE | AF | AG | AH | AI | AJ | AK | AL | AM | AN | AO | AP | AQ | AR | AS | AT | AU | AV | AW | AX | AY | AZ | BA | BB | BC | BD | BE | BF | BG | BH | BI | BJ | BK | BL | BM | BN | BO | BP | BQ | BR | BS | BT | BU | BV | BW | BX | BY | BZ | CA | |
---|---|---|---|---|---|---|---|---|---|---|---|---|---|---|---|---|---|---|---|---|---|---|---|---|---|---|---|---|---|---|---|---|---|---|---|---|---|---|---|---|---|---|---|---|---|---|---|---|---|---|---|---|---|---|---|---|---|---|---|---|---|---|---|---|---|---|---|---|---|---|---|---|---|---|---|---|---|---|---|
1 | Zip (ZCTA) | State | County | City | Median Household Income | Margin of Error | Mean Income | Margin of Error | Per Capita Income | Margin of Error | Percent of Households with Incomes $200K+ | Margin of Error | Median Household Income by Age of Householder | Household Income in the past 12 months | Race & Ethnicity | Population Density sq. mi. | Age & Sex | Median Age | Educational Attainment | Poverty | Unemployment | Housing Units | Owner versus Renter | Median Value of Owner-occupied Units | Households - people sharing a housing unit | Land Area sq. m. | |||||||||||||||||||||||||||||||||||||||||||||||||||||
Households | Families - include at least 2 people related by birth, marriage or adoption | Non families | |||||||||||||||||||||||||||||||||||||||||||||||||||||||||||||||||||||||||||||
Population | Female | Male | Families | Married couple families | Single parent families | ||||||||||||||||||||||||||||||||||||||||||||||||||||||||||||||||||||||||||
Householder under 25 years | Margin of Error | Householder 25 to 44 years | Margin of Error | Householder 45 to 64 years | Margin of Error | Householder 65 years and over | Margin of Error | Households | Less than $25,000 | $25,000 to $49,999 | $50,000 to $74,999 | $75,000 to $99,999 | $100,000 to $149,999 | $150,000 to $199,999 | $200,000 or more | Population | White | Black | Native | Asian | Islander | Other | Two | Hispanic | 0 to 9 Years | 10 to 19 Years | 20 to 29 Years | 30 to 39 Years | 40 to 49 Years | 50 to 59 Years | 60 to 69 Years | 70+ Years | 0 to 9 Years | 10 to 19 Years | 20 to 29 Years | 30 to 39 Years | 40 to 49 Years | 50 to 59 Years | 60 to 69 Years | 70+ Years | Population 25 Years and Over | No Diploma (%) | High School (%) | Some College (%) | Bachelors Degree (%) | Graduate Degree (%) | Family Households | Family Poverty (%) | Civilian labor force - 16 years and over |
Unemployment Rate (%) | Occupied Units | Owner-Occupied Units | Renter-Occupied Units | Married couple families | With own children under 18 years | Single parent families | With own children under 18 years | ||||||||||||||||||||||
5 | 01001 | Massachusetts | Hampden | Agawam Town | $72,444 | $7,594 | $94,323 | $7,189 | $41,144 | $3,166 | 7.2% | 2.6% | -$1 | -$1 | $89,464 | $35,459 | $102,075 | $14,139 | $47,379 | $9,025 | 6,791 | 947 | 1,353 | 1,187 | 689 | 1,406 | 718 | 491 | 16,088 | 13,989 | 526 | 0 | 591 | 0 | 44 | 249 | 689 | 1,424.7 | 16,088 | 914 | 375 | 923 | 945 | 1,026 | 1,137 | 1,225 | 1,547 | 861 | 818 | 991 | 1,051 | 924 | 1,226 | 1,139 | 986 | 45.4 | 12,509 | 7% | 27% | 28% | 22% | 14% | 4,055 | 3.9% | 8,846 | 5.4% | 7,069 | 6,791 | 4,936 | 1,855 | $236,300 | 6,791 | 4,055 | 2,959 | 874 | 1,096 | 588 | 2,736 | 29,247,431 |
6 | 01002 | Massachusetts | Franklin; Hampshire | Amherst Town; Pelham; Shutesbury | $65,013 | $13,710 | $104,186 | $16,083 | $38,627 | $4,833 | 13.9% | 3.5% | $17,431 | $7,648 | $81,969 | $18,090 | $107,578 | $31,692 | $83,889 | $10,815 | 9,985 | 2,624 | 1,520 | 1,185 | 967 | 1,418 | 885 | 1,386 | 27,323 | 19,286 | 1,566 | 24 | 2,613 | 132 | 24 | 1,619 | 2,059 | 513.1 | 27,323 | 1,030 | 1,801 | 4,655 | 1,162 | 1,262 | 1,382 | 1,208 | 1,479 | 808 | 1,901 | 5,069 | 1,054 | 1,062 | 1,445 | 984 | 1,021 | 25.3 | 13,750 | 2% | 12% | 14% | 23% | 47% | 4,854 | 7.1% | 15,630 | 7.0% | 11,301 | 9,985 | 4,763 | 5,222 | $388,300 | 9,985 | 4,854 | 3,747 | 1,684 | 1,107 | 584 | 5,131 | 137,931,891 |
7 | 01003 | Massachusetts | Hampshire | Amherst Town | -$1 | -$1 | -$1 | -$1 | $4,935 | $591 | 33.3% | 65.5% | -$1 | -$1 | -$1 | -$1 | -$1 | -$1 | -$1 | -$1 | 15 | 0 | 10 | 0 | 0 | 0 | 0 | 5 | 13,711 | 8,487 | 675 | 21 | 2,570 | 0 | 0 | 660 | 1,298 | 17,050.9 | 13,711 | 0 | 3,955 | 3,053 | 21 | 0 | 0 | 16 | 0 | 0 | 3,692 | 2,955 | 0 | 0 | 3 | 11 | 5 | 19.8 | 119 | 0% | 1% | 70% | 0% | 26% | 15 | 0.0% | 5,169 | 18.9% | 84 | 15 | 0 | 15 | -$1 | 15 | 15 | 15 | 0 | 0 | 0 | 0 | 2,082,670 |
8 | 01005 | Massachusetts | Worcester | Barre | $103,477 | $25,982 | $106,135 | $13,145 | $39,783 | $4,894 | 9.9% | 6.6% | -$1 | -$1 | $90,568 | $37,252 | $109,496 | $14,691 | $80,667 | $48,917 | 1,761 | 110 | 175 | 415 | 158 | 614 | 115 | 174 | 4,947 | 4,720 | 22 | 0 | 0 | 0 | 0 | 34 | 171 | 114.5 | 4,947 | 204 | 455 | 402 | 266 | 347 | 378 | 365 | 281 | 113 | 331 | 269 | 334 | 236 | 312 | 457 | 197 | 43.2 | 3,420 | 3% | 30% | 28% | 18% | 18% | 1,352 | 8.1% | 2,909 | 4.2% | 1,983 | 1,761 | 1,711 | 50 | $281,000 | 1,761 | 1,352 | 1,074 | 282 | 278 | 152 | 409 | 111,859,191 |
9 | 01007 | Massachusetts | Hampshire | Belchertown; Pelham | $101,076 | $8,471 | $113,474 | $7,311 | $43,450 | $2,854 | 10.5% | 3.0% | $32,950 | $24,375 | $116,586 | $7,763 | $125,615 | $18,851 | $52,027 | $13,123 | 5,917 | 525 | 795 | 816 | 773 | 1,707 | 678 | 623 | 15,304 | 13,687 | 52 | 0 | 491 | 0 | 168 | 289 | 617 | 278.9 | 15,304 | 782 | 677 | 874 | 1,021 | 975 | 1,166 | 1,215 | 926 | 767 | 1,296 | 997 | 811 | 1,006 | 941 | 1,175 | 675 | 42.8 | 10,778 | 2% | 23% | 26% | 23% | 23% | 4,262 | 3.8% | 8,915 | 2.5% | 6,237 | 5,917 | 4,964 | 953 | $288,300 | 5,917 | 4,262 | 3,455 | 1,267 | 807 | 241 | 1,655 | 142,111,112 |
10 | 01008 | Massachusetts | Berkshire; Hampden | Blandford; Granville; Otis; Tolland | $79,573 | $11,470 | $99,407 | $10,288 | $43,288 | $4,455 | 9.5% | 4.2% | -$1 | -$1 | $84,750 | $22,916 | $111,364 | $12,839 | $47,813 | $10,448 | 506 | 39 | 104 | 76 | 78 | 112 | 49 | 48 | 1,171 | 1,101 | 0 | 2 | 0 | 0 | 0 | 17 | 51 | 19.1 | 1,171 | 50 | 47 | 43 | 80 | 68 | 84 | 143 | 82 | 50 | 32 | 71 | 22 | 88 | 95 | 122 | 94 | 52.5 | 926 | 9% | 35% | 22% | 18% | 14% | 330 | 3.9% | 609 | 1.3% | 617 | 506 | 474 | 32 | $251,700 | 506 | 330 | 268 | 64 | 62 | 13 | 176 | 158,470,969 |
11 | 01009 | Massachusetts | Hampden | Palmer Town | $64,809 | $35,782 | $84,135 | $34,453 | $34,027 | $17,302 | 10.5% | 16.5% | -$1 | -$1 | $64,836 | $57,275 | -$1 | -$1 | -$1 | -$1 | 333 | 78 | 13 | 81 | 71 | 43 | 12 | 35 | 800 | 800 | 0 | 0 | 0 | 0 | 0 | 0 | 0 | 1,147.0 | 800 | 50 | 55 | 75 | 73 | 40 | 77 | 0 | 33 | 78 | 29 | 83 | 91 | 39 | 29 | 39 | 9 | 30.6 | 556 | 9% | 8% | 35% | 43% | 4% | 190 | 28.9% | 438 | 16.2% | 399 | 333 | 295 | 38 | $207,800 | 333 | 190 | 135 | 84 | 55 | 26 | 143 | 1,806,483 |
12 | 01010 | Massachusetts | Hampden; Worcester | Brimfield; Warren | $84,830 | $26,749 | $112,574 | $27,946 | $45,461 | $9,549 | 13.9% | 8.7% | -$1 | -$1 | $106,250 | $38,698 | $115,972 | $60,624 | $33,672 | $11,958 | 1,503 | 262 | 270 | 160 | 125 | 263 | 214 | 209 | 3,703 | 3,013 | 151 | 0 | 25 | 0 | 120 | 322 | 72 | 105.1 | 3,703 | 135 | 206 | 124 | 103 | 320 | 191 | 377 | 278 | 390 | 122 | 196 | 177 | 339 | 219 | 320 | 206 | 44.6 | 2,766 | 2% | 24% | 28% | 31% | 12% | 1,050 | 4.4% | 1,853 | 5.7% | 1,698 | 1,503 | 1,336 | 167 | $299,400 | 1,503 | 1,050 | 924 | 315 | 126 | 96 | 453 | 91,236,290 |
Easily spot the best zip codes for your new business location or your marketing campaigns.
Over 11,480 businesses trust us to provide current and accurate data.
I had a chance to put the data file to use and I love it!...I am going to show the team how it works today and tomorrow and we are forever indebted for you, as we now never have to visit the US Census site again!
I have found an outstanding team that was able to help me collect the data that was necessary for my project. Kristen was amazing! She did everything... to help me collect the data that I needed. Not only did she send me the data that I asked for, but she also went out of her way to send me additional information regarding my topic. I am very pleased with the service that Kristen and her team provided! I highly recommend using Cubit as a source for gathering data!
The report was sooo helpful... it would have taken at least a week for a staff member to compile all the data... we saved at least a couple thousand dollars by getting the report...
Show prices for
$499 All US
Best Value
Income By Zip Code List data plus:
Population; Population density; Age; Median age; Sex; Race/ethnicity; Education; Households; Housing units; Median value of owner-occupied units; Owner vs Renter; Poverty; Unemployment
$125 per State
Best Value
Income By Zip Code List data plus:
Population; Population density; Age; Median age; Sex; Race/ethnicity; Education; Households; Housing units; Median value of owner-occupied units; Owner vs Renter; Poverty; Unemployment
$249 All US
Median income; Average income; Per capita income; Percent high-income households; Median income by age of householder; Households by income ranges
States, Counties, Cities, GEOIDs, Land Area
$62 per State
Median income; Average income; Per capita income; Percent high-income households; Median income by age of householder; Households by income ranges
States, Counties, Cities, GEOIDs, Land Area
Median income; Population; Population density; Median age
Filters; Zoom & Pan; Data on the map
Median income; Population; Population density; Median age
Filters; Zoom & Pan; Data on the map
You'll get a link to download your data immediately after payment as well as an email with the link for your records. Our customers say that getting their questions answered by real people is the best part of working with us. Call us: 1-800-939-2130.
I'm the lucky lady who will be pulling your income and demographics data. Shhh....don't tell anyone, but I've been working with demographic data for 20 years now. I've worked with demographic data as a Research Associate in economic consulting, and a Socio-Economist in environmental engineering.
Now, as a Co-Founder of Cubit (maker of IncomeByZipCode.com), I've helped 11,480 people get demographic data fast. You can reach me at 1-800-939-2130 or the contact page.
You're going to be happy with your data. Just in case something out of left field happens & you're not happy, we'll cheerfully refund your money or work to fix the issue.