Richest Tennessee Zip Codes (2026)
by Anthony Morales 
Updated: Feb 9, 2026
The richest zip code in Tennessee is 37350 with an average household income of $295,539 and 2,111 people according to the most current Census data available (citation).
10 Richest Tennessee Zip Codes
per the most current (2024) Census data with at least 500 people and a reasonable margin of error
| Rank | Zip Code | Population | Mean Income | Median Household Income |
|---|---|---|---|---|
| 1 | 37350 | 2,111 | $295,539 | $201,000 |
| 2 | 37220 | 5,265 | $271,600 | $180,417 |
| 3 | 37046 | 7,310 | $253,740 | $178,228 |
| 4 | 37215 | 22,018 | $245,151 | $155,863 |
| 5 | 38120 | 13,309 | $243,896 | $123,538 |
| 6 | 38139 | 16,466 | $237,803 | $178,661 |
| 7 | 37027 | 61,630 | $229,514 | $154,578 |
| 8 | 37205 | 24,823 | $226,870 | $139,152 |
| 9 | 37069 | 20,209 | $226,463 | $157,939 |
| 10 | 37014 | 3,227 | $199,164 | $105,125 |
To identify the richest zip codes in Tennessee, we downloaded the most current income data from the US Census Bureau, excluded zips with fewer than 500 people, excluded the zips with margins of error greater than 50% of the income estimate and sorted by mean income. Click on the links above in the chart to see more income statistics for these wealthy Tennessee zips codes or learn more about the highest income zip codes in the US.
Tennessee Salary Data
- The average salary for full-time workers in Tennessee is $73,894.
- The median salary for full-time workers in Tennessee is $54,207.
The salary data above comes from the most current (2024) US Census’ American Community Survey (ACS) 5-year dataset and is based on earnings data for full-time workers. Note that earnings data includes both wage and salary data. The Bureau of Labor Statistics also publishes wage and salary data, but their dataset doesn’t include self-employed workers whereas the ACS dataset does include self-employed workers. Get help in the Median versus Average section to decide which statistic is best for your purposes.
Tennessee Individual Incomes
- The median income for single person households in Tennessee is $37,130. A single-person household is when one person lives alone in a home or apartment without any other people. They could be single, divorced, widowed, or just prefer living alone.
- The average income per person in Tennessee is $39,437, which is also known as the Tennessee per capita income. This figure tends to be lower than other income statistics, such as median household income, because it divides the total income by all people, including children and individuals who may not be working, rather than just by those earning an income.
Tennessee Family Income Data
- The average family income for Tennessee is $114,915.
- The median family income for Tennessee is $87,314.
Family income reflects the combined income of all earners in a family unit. Single-person households are not included in this calculation, as family income specifically refers to households with more than one person. Get help in the Median versus Average section to decide which statistic is best for your purposes.
Tennessee Retirement Income
- The total average retirement income in Tennessee is $52,750, which consists of $28,521 from retirement income and $24,229 from Social Security income.
Retirement income includes not only regular payments from pensions and retirement accounts like 401(k)s or IRAs but also survivor benefits for spouses or children of deceased individuals and disability pensions for those unable to work due to a disability. Social Security income includes payments from Social Security and U.S. railroad retirement pensions, survivor benefits, and disability insurance from the Social Security Administration, but excludes Medicare reimbursements.
Tennessee Income Levels or Income Distribution
| Households | 2,824,277 | 100% |
|---|---|---|
| Less than $10,000 | 147,257 | 5% |
| $10,000 to $14,999 | 112,145 | 4% |
| $15,000 to $19,999 | 100,292 | 4% |
| $20,000 to $24,999 | 109,966 | 4% |
| $25,000 to $29,999 | 101,516 | 4% |
| $30,000 to $34,999 | 108,852 | 4% |
| $35,000 to $39,999 | 108,768 | 4% |
| $40,000 to $44,999 | 119,153 | 4% |
| $45,000 to $49,999 | 111,013 | 4% |
| $50,000 to $59,999 | 208,501 | 7% |
| $60,000 to $74,999 | 279,786 | 10% |
| $75,000 to $99,999 | 371,698 | 13% |
| $100,000 to $124,999 | 281,300 | 10% |
| $125,000 to $149,999 | 194,157 | 7% |
| $150,000 to $199,999 | 216,988 | 8% |
| $200,000 or more | 252,885 | 9% |
Tennessee Median Income by of Age of Householder
| Tennessee | |
|---|---|
| Householder under 25 years | $43,550 |
| Householder 25 to 44 years | $78,012 |
| Householder 45 to 64 years | $82,922 |
| Householder 65 years and over | $51,886 |
This table illustrates the median household income in Tennessee by the age of the householder. Younger householders under 25 years old have low median income at $43,550. Income levels increase significantly for householders in the middle age ranges. However, income tends to decrease for householders aged 65 and over, with a median income of $51,886. This pattern reflects typical income trends, where earnings tend to peak during mid-career years and taper off as individuals transition into retirement.
Median Income versus Average Income: Which Should You Use?
We usually suggest using median income data – either instead of or in addition to – average income data as a true indicator of wealth. If you haven’t thought about median versus average since your last standardized test, you aren’t alone. Here’s what they are:
- average is the sum of a set of numbers divided by the count of numbers in the set
- median is the middle number in the set of numbers
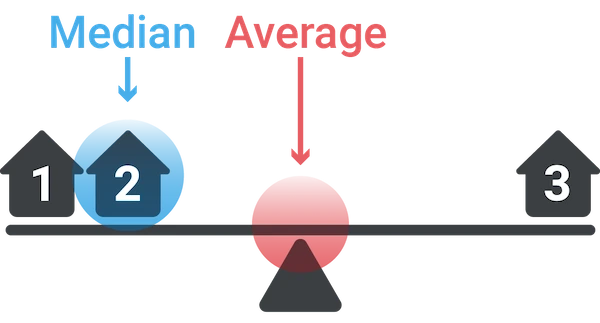
Now let’s say you had the following simplified set of income data.
Household 1: $30,000
Household 2: $50,000
Household 3: $1,000,000
The average income for this set is $360,000. The outlier data point ($1,000,000) skews the average WAY up. Conversely, the average income would be skewed WAY down if someone had an income of $500. The median income for the same data set is $50,000. Outlier data doesn’t skew the median.
Most Business Owners Should Use Median Income
So most business owners should use the median income as a true indicator of wealth, because it provides a more accurate representation of a typical income, especially in areas with significant income disparity.
When Should You Use Average Income
If your target market is high-income households, the average income may be more relevant. This is because the average income can highlight the presence of a higher concentration of wealthy individuals, which is beneficial for luxury goods and services marketing. We’re using average income on this page because using the Census’s highest reported median value of $250,001 could result in multiple ties for the richest geography.
Why do so many zip codes have a median value of $250,001?
The Census' American Community Survey uses $250,000+ as a jam value for median income estimates to protect privacy, ensure data consistency, and simplify reporting. A "jam value" in survey data refers to a placeholder or default value used when actual data points are unavailable, incomplete, or exceed certain thresholds. We represent this jam value as $250,001 to make it easy for you to sort.
About the Data
Sources & Margins of Error
All statistics for Tennessee are the most current, comparable statistics available from the US Census Bureau and are from the American Community Survey 2024 5-year estimates. The income values are in 2024 inflation-adjusted dollars and were downloaded on 29 January 2026.
The following data tables were used:
- B01001 Sex By Age
- B11003 Family Type by Presence and Age of Own Children Under 18 Years
- B19001 Household Income in the Past 12 Months (in 2024 inflation adjusted dollars)
- B19013 Median Household Income in the Past 12 months (in 2024 inflation-adjusted dollars)
- B19019 Median Household Income in the Past 12 Months (in 2024 Inflation-Adjusted Dollars) by Household Size
- B19049 Median Household Income In The Past 12 Months (in 2024 Inflation-adjusted dollars) By Age Of Householder
- B19055 Social Security Income in the Past 12 Months for Households
- B19059 Retirement Income in the Past 12 Months for Households
- B19065 Aggregate Social Security Income in the Past 12 Months (in 2024 Inflation-Adjusted Dollars) for Households
- B19069 Aggregate Retirement Income in the Past 12 Months (in 2024 Inflation-Adjusted Dollars) for Households
- B19113 Median Family Income in the Past 12 Months (in 2024 Inflation-Adjusted Dollar
- B19127 Aggregate Family Income in the Past 12 Months (in 2024 Inflation-Adjusted Dollars)
- B19301 Per Capita Income in the Past 12 months (in 2024 inflation-adjusted dollars)
- B20003 Aggregate Earnings in the Past 12 Months (in 2024 Inflation-Adjusted Dollars) by Sex by Work Experience for the Population 16 Years and Over With Earnings
- B20005 Sex by Work Experience in the Past 12 Months by Earnings in the Past 12 Months (in 2024 Inflation-Adjusted Dollars) for the Population 16 Years and Over
- B20018 Median Earnings in the Past 12 Months (in 2024 Inflation-Adjusted Dollars) for the Population 16 Years and Over Who Worked Full-Time, Year-Round With Earnings in the Past 12 Months
- S1902 Mean Income in the Past 12 months (in 2024 inflation-adjusted dollars)
Margins of error for the income data for Tennessee
- Median Household Income: +/-$429
- Average Household Income: +/-$550
- Per Capita Income: +/-$230
- Median Household Income: Householders under 25: +/-$1,179
- Median Household Income: Householders 25 to 44: +/-$787
- Median Household Income: Householders 45 to 64: +/-$864
- Median Household Income: Householders 65+: +/-$527
Poverty Thresholds for 4 Person Households
U.S. Department of Health and Human Services. (2024). Annual update of the HHS poverty guidelines. Federal Register.
Looking for a List of Zip Codes with Income?
If you value your time at $50 an hour, you could waste hundreds of dollars and many hours searching for data. Or you can work with the data experts at Cubit to make sure you get the most current demographics available from government data sources. All of our work comes with a 100% money-back guarantee.
Get all zip codes in your state or the entire US with data such as median household income.